Hypertensive Urgency in the Office: Should You Send the Patient to the ER?

3274162699_a0b18c969a_b-e1466098600672.jpg

You’re in the office seeing a patient, and take a look at the vitals.  Blood pressure 190/110. Being the diligent physician you are, you recheck the blood pressure manually, in both arms, after having the patient relax in a quiet room for 5 minutes.  190/110. There are no symptoms. What do you do? The situation I just described is known as hypertensive urgency, which is a systolic pressure over 180 or a diastolic pressure over 110 without any evidence of end-organ damage. And what to do with patients in this situation is a clinical grey area that, thanks to a manuscript appearing in JAMA Internal Medicine, may finally be seeing the light of day.

For the video version of this post, click here.

The Methods

The study, out of the Cleveland Clinic, gives us some really important data. Here’s how it was done. The researchers identified everyone in that Healthcare system who had an outpatient visit with hypertensive urgency over a 6-year time frame. Of over 1 million visits – just under 60,000, about 5% - had blood pressures consistent with hypertensive urgency. Now, some of those individuals were sent to the hospital for evaluation, the rest were sent home. What percent do you think went to the hospital?

If you answered “less than 1%”, you’re spot on and a way better guesser than I am. I actually assumed the rate would be much higher.  Now, how can we evaluate whether sending someone to the hospital is the “right” move. And let’s not fall into the assumption that sending someone to the hospital is a “safe” option. Those of us who work in hospitals will quickly disabuse anyone of that notion.

The problem is that those who got sent to the hospital were doing worse than those who got sent home. They had higher blood pressures in the “urgency” range, with a mean systolic of 198 compared to 182 in those sent home.

To create a fair assessment of the effects of sending someone to the hospital, the authors performed a propensity-score match.  Basically, they matched the people who got sent to the hospital with people of similar characteristics that didn't. Comparing the matched groups, they found… nothing.

No increased risk of major adverse cardiovascular events.  In other words, the people sent home weren’t having strokes during the car ride.

A curious finding

One thing I did note was that those sent to the hospital were much more likely to have a hospital admission sometime in the next 8 – 30 days compared to those who got to go home.  This either means that some bad stuff happens in that initial hospital referral that leads them to bounce back later in the month or, and I’m favoring this interpretation here, the propensity match didn’t catch some factors that predisposed the hospitalized people to hospitalization in general – factors like socioeconomic status, for instance. If that’s true, then we’d actually expect the hospitalized group to do worse than their controls. The fact that they didn’t may argue that the hospital actually did something beneficial. But we are way down the causality rabbit hole here.

Conclusion

In the end I take home two things from this study.  First, the shockingly low rate of referral to hospital for hypertensive urgency.  Seriously – is this just a Cleveland Clinic thing? Feel free to let me know in the comments.  And two – that for the right patient, a dedicated outpatient physician can probably do just as much good as a costly trip to the ED.

Migraine: A New Cardiovascular Risk Factor?

Migraine.jpg

I’m going to get personal here.  I had my first migraine - in my life - about three weeks ago. For those of you who have been longtime sufferers, I am truly sorry.  I was literally testing my own neck stiffness to make sure I didn’t have meningitis. But aside from the blistering pain knocking you out of commission for several hours (or several days), a new study appearing in the BMJ suggests there is something else migraine sufferers need to worry about – cardiovascular disease.

For the video version of this post, click here.

Researchers used data from the Nurses Health Study 2, a large, questionnaire-based prospective cohort study that began back in 1989 and enrolled over 100,000 nurses. The idea here was that the nurses (all female by the way) would be more reliable when answering health-related questionnaires than the general public.

In 1989, 1993, and 1995 the questionnaire asked if the women had been diagnosed, by a physician, with migraine. That’s it. No information on treatment, severity, or the presence of aura – a factor that has been associated with cardiovascular disease in the past.

This response was linked to subsequent major cardiovascular events including heart attack, stroke, and coronary interventions.

The researchers found a higher rate of this outcome among those who had been diagnosed with migraine. In fact, even after adjusting for risk factors like age, cholesterol, diabetes, hypertension, smoking, and more, the risk was still elevated by about 50%. So those of us with migraines – is it time to freak out?

Not too much.  The overall rate of major cardiovascular events in this cohort was just over 1% - not exactly common. That means the absolute risk increase is 0.5%, which doesn’t sound quite as dramatic as the 50% relative risk increase.  Putting that another way, for every 200 patients in this cohort with migraine, there was one extra case of cardiovascular disease.  Not exactly a risk factor to write home about.

But, to be fair, cardiovascular disease gets more common as we age – had the study had even longer follow-up, we might have seen a higher event rate.

Other studies have found similar findings with migraine. The women’s health study, for instance, found a nearly two-fold increased risk in cardiovascular events, but only in those who had migraine with aura – a covariate missing from the current dataset.

Should women with migraine take precautions against cardiovascular disease? The jury is out. Since we don’t know the mechanism of the link, if any, we don’t know the best way to treat it.  But clearly any studies of migraine therapy would do well to keep an eye on cardiovascular endpoints.

Marijuana use and brain function in middle age

weeee.jpg

For the video version of this post, click here. The public attitude towards marijuana is changing. Though some continue to view the agent as a dangerous gateway to harder drugs like cocaine and heroin, increasing use of the drug for medical purposes, and outright legalization in a few states will increase the number of recreational pot users. Its high time we had some solid data on the long-term effects of pot smoking, and a piece of the puzzle was published today in JAMA internal medicine.

Researchers leveraged an existing study (which was designed to examine risk factors for cardiac disease in young people) to determine if cumulative exposure to marijuana was associated with impaired cognitive function after 25 years. Note that I said "impaired cognitive function" and not "cognitive decline". The study didn't really assess the change, within an individual, over the 25-year period. It looked to see if smokers of the ganj had lower cognition scores than non-smokers.

That minor point aside, some signal was detected. After 25 years of followup, individuals with higher cumulative use had lower scores on a verbal memory test, a processing speed test, and a test of executive function.

But wait – those numbers are unadjusted. People with longer exposure time to weed were fairly different from non-users. They were less likely to have a college education, more likely to smoke cigarettes, and, importantly, much more likely to have puffed the magic dragon in the past 30 days.

Accounting for these factors, and removing from the study anyone with a recent exposure to the reefer showed that longer cumulative exposure was only associated with differences in the verbal learning test. Processing speed and executive function were unaffected.

Now, the authors make the point that there was a dose-dependent effect with "no evidence of non-linearity". What that is code for is that there isn't a "threshold effect". According to their model, any pot would lead to lower verbal scores. Take a look at this graph:

Verbal memory scores based on cumulative pot exposure

What you see is a flexible model looking at marijuana-years (by the way, one year means smoking one doobie a day for 365 days). The authors' point is that there isn't a kink in this line – the relationship is pretty linear. But look at the confidence intervals. The upper bound doesn't actually cross zero until five years. In short, the absence of an obvious threshold doesn't mean that no threshold exists. It is likely that the study was simply underpowered to detect threshold effects.

The most important limitation, though, was that the authors didn't account for age-of-use on the cognitive outcomes. With emerging evidence that pot-use at younger ages may have worse effects on still-developing brains, this was a critical factor to look at. Five years of pot exposure may be much different in a 25-year old than in an 18-year old. This data was available – I'm not sure why the interaction wasn't evaluated.

In the final analysis, I think we can confirm what common sense has told us for a long time. Pot certainly isn't magical. It is a drug.  It's just not that bad a drug. For the time being, the data we have to work with is still half-baked.

The US spends an appropriate amount on end of life care, if you massage the numbers a bit.

healthcare-investing-2016-450x372.jpg

For the video version of this post, click here. I think it's fair to say that there is a certain narrative regarding costs of health care in the United States. It goes like this:  "The US spends more on healthcare than any other nation, and gets less for it".

Is that really true?

Moreover, how do we even compare costs between nations? Well, given that around 25% of Medicare expenditures are accrued in the last year of life, researchers from the University of Pennsylvania examined how 7 different countries – all large, western democracies, including the US, treat individuals who died with cancer. The research appears in the Journal of the American Medical Association. Using national registries in each of the countries, Zeke Emanuel and colleagues were able to look at questions like what percentage of individuals died in the hospital and, importantly, how much money did each country spend on them.

These types of studies can be difficult to interpret, so I'll give you the party line first, and then some criticisms. First off, the good news, the US had lower rates of death in the hospital than any of the 6 other countries at 22%. Compare that to 52% in Canada.  That 22% figure is WAY down from rates in the 1970's where more than 70% of individuals with cancer in the US died in the hospital.

What about costs? Well, the standard narrative didn't hold up that well. In the last 6 months of life, the average American with cancer accrued around $27,000 worth of hospital costs. That's a lot more than those in The Netherlands ($13,000), but pretty similar to those in Canada and Germany.

I wouldn't be surprised if we see certain press outlets, or, perish the thought, politicians crowing about how American health care costs seem pretty manageable.  But here are some things to consider.  First, this study only examined cancer patients.  What's more, they only examined cancer patients who died. This says nothing about the myriad other costs our highly-medicalized society accrues on the day to day. Second, the study looked only at inpatient hospital costs. Americans spend less time in the hospital at the end of life thanks to a fairly robust nursing facility and hospice system. None of those costs were included.  Third, in the US physician fees are billed separately from hospital fees. Not so in the other six countries, and physician fees were NOT included in the US calculus.

Finally, a bit of a technical issue. How do you convert from, say, Euros to dollars in a study like this? The intuitive answer would be to use some average exchange rate over the time period studied. The authors actually used the health-specific purchasing power parity conversion rate. That's a mouthful, but basically it's a number that reflects the relative costs of purchasing a market-basket of health related goods in each country and adjusts for that.  In other words, countries where healthcare is cheaper (relative to the true exchange rate) would have their end-of-life costs adjusted upwards, making them look more expensive. I suspect this could move the final numbers by as much as 20% in either direction.

So there you go. We're doing OK here in the US, at least when it comes to caring for patients with cancer. But remember that complacency can be costly.


Being a woman versus being womanly: the implications after heart attack

Screenshot-2014-04-19-at-5.08.56-PM.png

For the video version of this post, click here. There are two elements you can expect to see in almost any study: the first is some effect size - a measure of association between an exposure and outcome. The second is a subgroup analysis - a report of how that effect size differs among different groups. Sex is an extremely common subgroup to analyze - lots of things differ between men and women. But a really unique study appearing in the Journal of the American College of Cardiology suggests that sex might not matter when it comes to coronary disease. What really matters is gender.

The study, with cumbersome acronym GENESIS-PRAXY, examined 273 women and 636 men of age less than 55 who were hospitalized with Acute Coronary Syndrome (ACS). Sex was based on self-report, and was binary (man or woman). But gender isn’t sex. Gender is a social construct that represents self-identity, societal roles, expectations and personality traits, and can be a continuum - think masculine and feminine.

The authors created a questionnaire that attempted to assign a value to gender. Basically, questions like - “how much of the child-rearing do you perform” or “are you the primary breadwinner for your household” - in other words these are based on traditional gender norms - but that’s as good a place to start as any. A score of 100 on the gender scale was “all feminine”, and a score of 0 “all masculine”.  Most of the males in the study clustered on the masculine end of the spectrum, while the females were more diverse across the gender continuum.

What was striking is that the primary outcome - recurrence of acute coronary syndrome within a year, was the same regardless of sex - 3% in men and women.  But a greater degree of “femininity” was significantly associated with a higher recurrence rate. Feminine people (be they male or female) had around a 5% recurrence rate compared to 2% of masculine people. This was true even after adjustment for sex, so we’re not simply looking at sex in a different way - gender is its own beast.

What does it all mean?  Well, it shows us that our binary classification of sex may be too limited in the biomedical field. Of course, there will always be hard and quantifiable physiologic differences between men and women. But what is so cool is that it’s the more difficult to quantify gender-related differences that may matter most when it comes to health and disease.

Of course, this conclusion is way too big to be supported by one small study with a 3% event rate. But given the surprising and really interesting nature of the results, I’m sure we’ll have many more studies of this sort following close behind. 


Miserable? Happy? You'll live just as long either way.

Deborah_Moggach.jpg

For the video version of this post, click here. We've been doing these 150 second analyses for about 6 months now, so I feel I can ask you this:  Are you happy? Really happy?

Well it turns out it doesn't matter.

Plenty of observational data has suggested that higher levels of happiness are associated with greater longevity. This feels right, in some sense, but this data doesn't come from randomized trials. I'm not really sure how you'd randomize someone to be happier anyway – maybe something with puppies.

You've been randomized to happiness!

You've been randomized to happiness!

The issue is that sicker people probably don't feel as happy, so unless you account for that, how can you really say that happiness leads to longer life?

Researchers, writing in The Lancet, attempted to tackle this issue by going big. Really big. They examined around 700,000 women who participated in the Million Women Study in the United Kingdom.  These women, who were all aged 50-69, were asked simply how often they felt happy: never, rarely, sometimes, usually, or most of the time. They were then followed for around 15 years to examine cause-specific mortality.

Happier women were generally older, got more exercise, and avoided smoking.  They were also more likely to be Scottish and tended to drink more alcohol, so keep that in mind the next time you visit Loch Lomond.

As you might expect, lower levels of self-reported happiness were associated with higher mortality. Women who were happy most of the time had a mortality rate of around 4% in follow-up, compared to 5% among women who were generally unhappy.

This difference disappeared, though, when the authors adjusted for self-rated health. The conclusion? Happiness doesn’t matter.

But here's the thing: self-rated health is subjective, just like happiness is. When the researchers adjusted for objective health issues: depression, anxiety, hypertension, diabetes, being unhappy still led to an increased risk of death.

Let's also remember that being unhappy may lead to certain unhealthy behaviors – like smoking cigarettes. Adjusting for factors that lie along the causal pathway from exposure to outcome is an epidemiologic no-no. Finally, it strikes me as odd that we'd consider categorizing something as ineffable as happiness with a single survey question.

What I take from this study is the following:  Feeling unhappy is a real risk factor for mortality. So is feeling sick.  But I'm not ready to conclude that happiness is just a bystander, exerting no real effect on outcomes. We won't know for sure without that puppy-based clinical trial. But until then I'll leave you with the words of a wise woman who died before her time: Such is the force of happiness, the least - can lift a ton, assisted by its stimulus.

BMI is Dead. Long Live BMI!

howmuchweigh.jpg

For the video version of this post, click here. Body mass index. Since the term entered the medical consciousness in 1972, it has served admirably as a proxy measure for body fat, since body fat itself is sort of tough to measure. But it is demonstrably imperfect. Since it relates weight to height, it has no ability to distinguish between fat mass and muscle mass, leading to so called “obesity paradoxes” that are really no such thing. We need something better than BMI.

That something better, according to an article appearing in the Annals of Internal Medicine, may be the ratio of waist to hip circumference.

The study has some dramatic results.  Using data from the National Health and Nutrition Examination Survey, researchers examined around 15,000 participants. Each participant had a BMI and a waist-to-hip ratio.  It turned out that waist-to-hip ratio was a much better predictor of mortality and cardiovascular disease than BMI.

In fact, once you accounted for waist-to-hip ratio, BMI didn’t predict mortality at all.  What this suggests is that all those studies linking BMI to bad outcomes were secretly studies linking central obesity to bad outcomes (because BMI and central obesity are correlated).  But when you introduce a better measure of central obesity, the utility of BMI goes out the window. It’s a proxy measure without a home.

It turned out that, among men with normal BMIs, those with a high waist-to-hip ratio had an 87% higher risk of death. Women with normal BMIs and central obesity had a 50% higher risk of death. Perhaps more interesting, men with normal BMIs and central obesity had around twice the risk of death of men who were overweight or obese by BMI but who didn’t have central obesity. Women’s results went in the same direction, though the magnitude wasn’t as great.

So, do we give up on BMIs altogether?  Not necessarily.  Waist-to-hip ratio does seem to be the superior risk marker, but it’s not as easy to measure. These data were collected by individuals trained to do these measurements the same way, every time - it may not be possible to do that in the doctor’s office and get reliable results. Though maybe we could start employing tailors.

Also, remember that BMI still captures a lot of this data. The finding that individuals with normal BMI but high waist-to-hip ratio have increased mortality is compelling, but only 11% of men and 3% of women fit in this category. In other words, chances are if you have a normal BMI you’re fine. That said, it seems clear now that we need to find something better than BMI, something that helps distinguish between fat mass and muscle in a way that BMI can not. Whether a technological solution, such as bioimpedance analysis, or an anthropometric solution like the one in this study takes the baton, my intuition is that BMI now has a shelf-life.


Is there anything coffee can't do?

8777910107_231af75382_z.jpg

For the video version of this post, click here.

Coffee. It’s hard not to be biased when it comes to the ubiquitous drink. Many of us, myself included, depend on the stuff to start our day, continue our day, and give us something to do when we should otherwise be working. Studies linking coffee to better health get a lot of press. A few months ago, a big splash was made when a study linked coffee consumption to lower risk of melanoma (though they failed to account for sun exposure). Now, we have coffee staving off colon cancer.

The paper, appearing in the Journal of Clinical Oncology, examined roughly 1000 individuals with stage 3 colon cancer, who had been through at least the first round of surgery and chemotherapy. Each of them filled out a detailed food-frequency questionnaire within a couple months after the initial treatment, and they were followed prospectively for cancer recurrence or death.

The majority of the cohort reported drinking 1-3 cups of coffee per day. A small number, 6%, reported taking more than 4 cups per day. Heavy coffee drinkers were more likely to be male, white, and smokers, and had a higher level of physical activity.

After around 7 years of follow-up, 35% of the patients had experienced cancer recurrence or died. Among those who drank 4 or more cups of caffeinated coffee per day, the overall risk of recurrence or death was reduced by about 50% after adjustment for confounders.

Let that sink in a minute. 50%. Has one of the most potent anti-cancer agents been literally sitting under our nose all these years? Well, as much as I’m a java fan, I might need to cool this off a bit.

First off, these patients were part of a clinical trial evaluating the role of adding irinotecan to standard adjuvant chemotherapy for colon cancer. Clinical trials recruit very specific patients - these results may not hold for your typical colon cancer survivor. 

Another issue: Food frequency questionnaires generate a ton of data - you can't possibly control for everything people eat. The authors adjusted their results for total caloric consumption, but it is possible that foods that correlate with coffee intake are the actual drivers of the relationship here. Put simply, it's just as likely that this is a biscotti effect as a coffee effect.

Finally, the big issue: What do we mean when we say coffee? Is an espresso the same as a venti caramel macchiato? Does it matter where the beans come from? How they are roasted? How much sugar you add to it? This is the central problem of dietary research, and one that can only be overcome by randomized trials.

So let’s do it. There seems to be enough data now to justify actually trying this under controlled settings. My prediction is that we won’t see a 50% reduction in recurrence of colon cancer, but we may see something. After all, coffee is a drug. A wonderful, tasty, necessary drug that goes great with pie.


Antidepressants During Pregnancy and a Rare, Fatal Disease in Newborns

Hospital_newborn_by_Bonnie_Gruenberg7 For the video version of this post, click here.

There’s a reason why so few medications are recommended during pregnancy, and for the most part it’s not because we have evidence that they cause fetal harm. No, the reason so few drugs are recommended in pregnancy is because they’ve never been tested in pregnant women.  With the exception of a few medications explicitly designed for pregnancy, pregnant women are almost universally excluded from clinical trials.

So to determine if a drug may be harmful in pregnancy, we have to use observational data, and that means adjustment.  This week, we can use a study appearing in the Journal of the American Medical Association as a perfect example.

Do anti-depressants, when used in pregnancy, increase the risk of persistent pulmonary hypertension of the newborn?  PPHN is a very rare, but highly morbid condition whereby the fetal circulation persists after birth, leading to hypoxia, respiratory failure, and in about 10% of cases, death.

To determine if anti-depressants increase the risk of PPHN, a group of Harvard researchers used data from the Medicaid eXtract database, comprising almost 4 million pregnant women. Of those 4 million, about 130,000 had filled a prescription for an anti-depressant towards the end of pregnancy, mostly SSRIs. The rate of PPHN was 20 out of 10,000 births among those not taking anti-depressants, and 30 out of 10,000 births among those who did.  Case closed?

Well, no. These women weren’t randomized to take anti-depressants, they took them for a reason, and lots of factors play into this: depression, obviously, but also personal beliefs, access to care, and any number of other confounders.

Enter adjustment. The authors worked very hard to identify a slew of confounders, and after accounting for them, the relationship between anti-depressants and PPHN went away. So it would seem that women who are more prone to take anti-depressants are more prone to have a child with PPHN, but the medications are not causal.

Unless...there was over-adjustment.  Over-adjustment occurs when you statistically account for something that lies on the causal pathway between the exposure and outcome of interest.  As an example, what if anti-depressants increase the risk of premature birth, which increases the risk of PPHN.  Adjusting for prematurity would make it look like the medications were safe, when in fact they weren’t.

It can be hard to tease out.  But there’s a really important fact that we shouldn’t forget here. All medications have risks, and all medications have benefits. Depression in a mother is a much, much greater risk to a newborn than PPHN.

Personally, I think the signal of harm is small enough to essentially be insignificant. For women with depression, these medications may, in fact, dramatically benefit both mother and baby.

Is a Firm Handshake the New Fountain of Youth?

punch-316605_1280  

For the video version of this article, click here.

Normally, in 150 seconds, I give a synopsis of a breaking study – something that just hit the news.  Today, we’re taking a different angle, and tackling a study that has had time to breathe for a while.

The Prospective Urban Rural Epidemiology, or “PURE” study, published in the Lancet reports on the association between grip strength and a variety of bad outcomes ranging from diabetes to cardiovascular disease, to death.

It’s a big study, involving nearly 150,000 people across 17 countries. The headline-grabbing finding was an association between weaker grip strength and subsequent all-cause mortality.  The take-home, for every 5 kg less grip strength you have, there’s a 16% increased risk of death.

But once the study moved from the peer-reviewed and venerable pages of The Lancet into the press, things got a bit messy. So I want to apply some much-needed context.

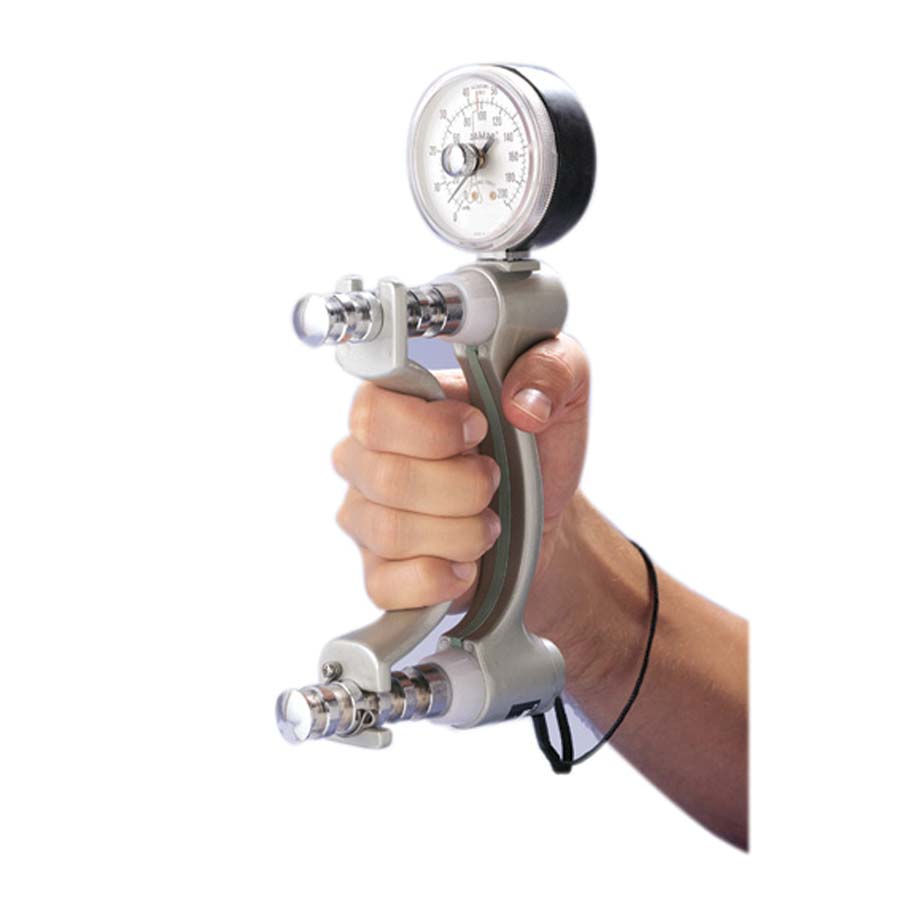
Let’s get one thing out of the way first.  Grip strength is NOT the same as handshake strength.  This is a grip strength dynamometer, used to precisely measure the maximum force the hand can generate, which is a product of a variety of factors including muscle mass and the length of the forearm:

p_9495_1341841676


A handshake is a social construct, and has nothing to do with anything.  This was not a study about forceful handshakes.

Second – this study describes an association.  It is very probable that a strong grip says something about your overall health.  It is NOT probable that grip strength is directly tied to outcomes.  The article in no way implies that hand strengthening should be a public health intervention.

But the real issue here is applicability.  With a study of almost 150,000 people, it’s not hard to find significant associations.  The clinical question is: Can measuring grip strength help me risk stratify patients?  Put another way, if I had two random patients in front of me, how often would the person with more grip strength live longer? If the answer is 50%, that’s chance, and the test is useless. If the stronger person always lives longer, it’s a perfect test and we should be doing it on everyone all the time.  The truth, of course, is somewhere in the middle.

But here’s the letdown. The authors don’t report their full, multivariable model, so we don’t know how well grip strength categorizes risk, only that there is an association there. Based on the authors’ comparison with blood pressure as a risk factor, I suspect that accounting for grip strength would address some of the randomness in figuring out who dies when, but only a small amount, probably around 2-5%.

So what’s impressive about this study isn’t the results.  That stronger people live longer is not particularly exciting.  What’s impressive is the logistics.  150,000 people, 17 countries, prospectively collected outcomes. This is good, if not revolutionary work. So despite the flaws of the reporting in the press, we can still hand it to the researchers.