
Normal Body Temperature is Actually 98.0 Degrees
/We’re more cold-blooded than we thought.
Every branch of science has its constants. Physics has the speed of light, the gravitational constant, the Planck constant. Chemistry gives us Avogadro’s number, Faraday’s constant, the charge of an electron. Medicine isn’t quite as reliable as physics when it comes to these things, but insofar as there are any constants in Medicine, might I suggest normal body temperature. Thirty-seven degrees Celsius, 98.6 degrees Fahrenheit.
Sure, the serum sodium may be less variable, the lactate concentration more clinically relevant, but even my seven-year-old knows that normal body temperature is 98.6 degrees.
Except, as it turns out. 98.6 degrees isn’t normal at all.
Where do we get 37.0 degrees Celsius from as normal body temperature? We get it from German physician Carl Reinhold August Wunderlich, who, in addition to looking eerily like Luciano Pavarotti, was the first to realize that fever was not itself a disease, but a symptom of one.

I have never seen Wunderlich and Pavarotti in the same room.
In 1851, he released his measurements of over 1,000,000 body temperatures taken from 25,000 Germans – a painstaking process at the time which employed a one-foot long thermometer that took 20 minutes to make a measurement.
The average temperature measured, of course, was 37 degrees Celsius.
We’re more than 150 years post-Wunderlich right now, and the average person in the US might be quite a bit different than the average German in 1850. Moreover, we can do a lot better than just measuring a ton of people and taking the average. Because we have statistics.
The problem with measuring a bunch of people and taking the average temperature as normal is that you can’t be sure that the people you are measuring are normal. There are obvious causes of elevated temperature that you could exclude – let’s not take people with a respiratory infection or who are taking Tylenol for example, but as highlighted in this paper in JAMA Internal Medicine, we can do a lot better than that.

The study leverages the fact that people get their body temperature measured all the time in medical offices, and all those temperatures get recorded in the ever-present electronic health record. Researchers from Stanford identified 724,199 patient encounters with outpatient temperature data. They excluded extreme temperatures – less than 34 degrees Celsius or greater than 40 degrees Celsius, excluded those under 20 or above 80 years, and those with extremes of height, weight, or BMI.
You end up getting a distribution like this – note that the peak is clearly lower than 37.0 Celsius.
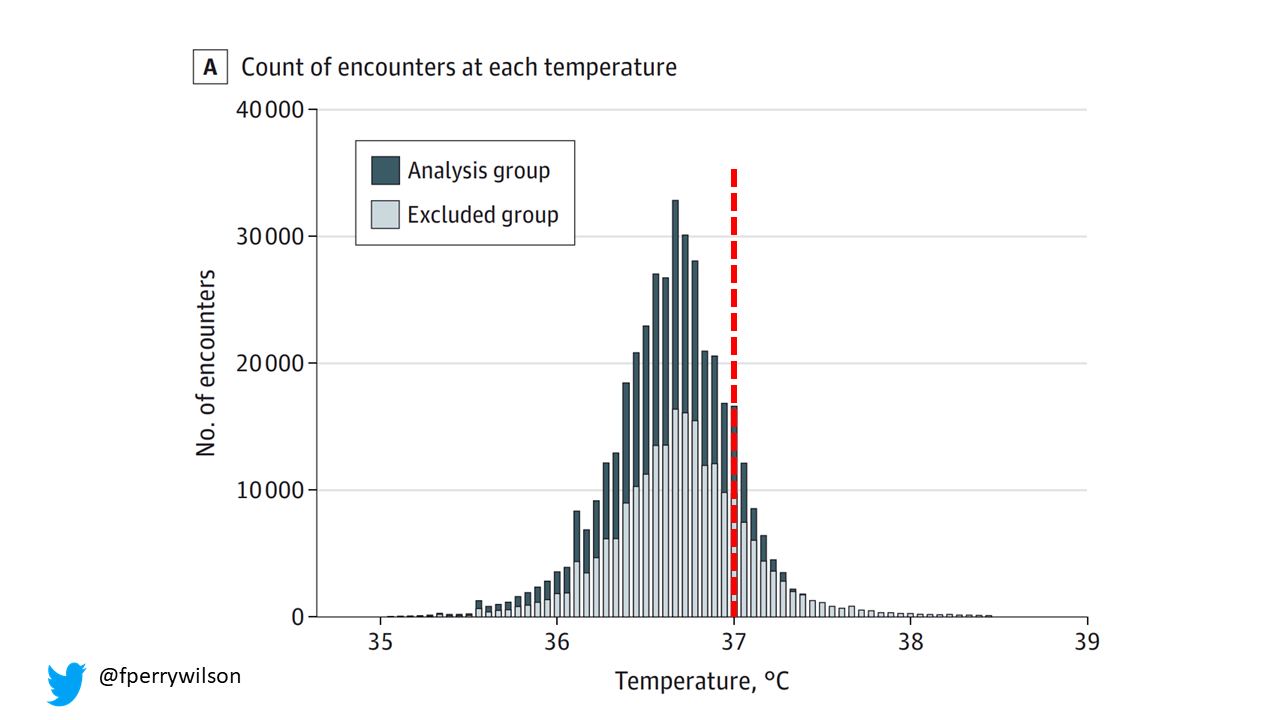
But we’re still not at “normal”. Some people would be seeing their doctor for conditions that effect temperature – like infection. You could use diagnosis codes to flag these individuals and drop them but that feels a bit arbitrary and I really love how the researchers use data to fix this problem.
They use a technique called LIMIT (Laboratory Information Mining for Individualized Thresholds). It works like this.
Take all the temperature measurements, and then identify the outliers – the very tails of the distribution.
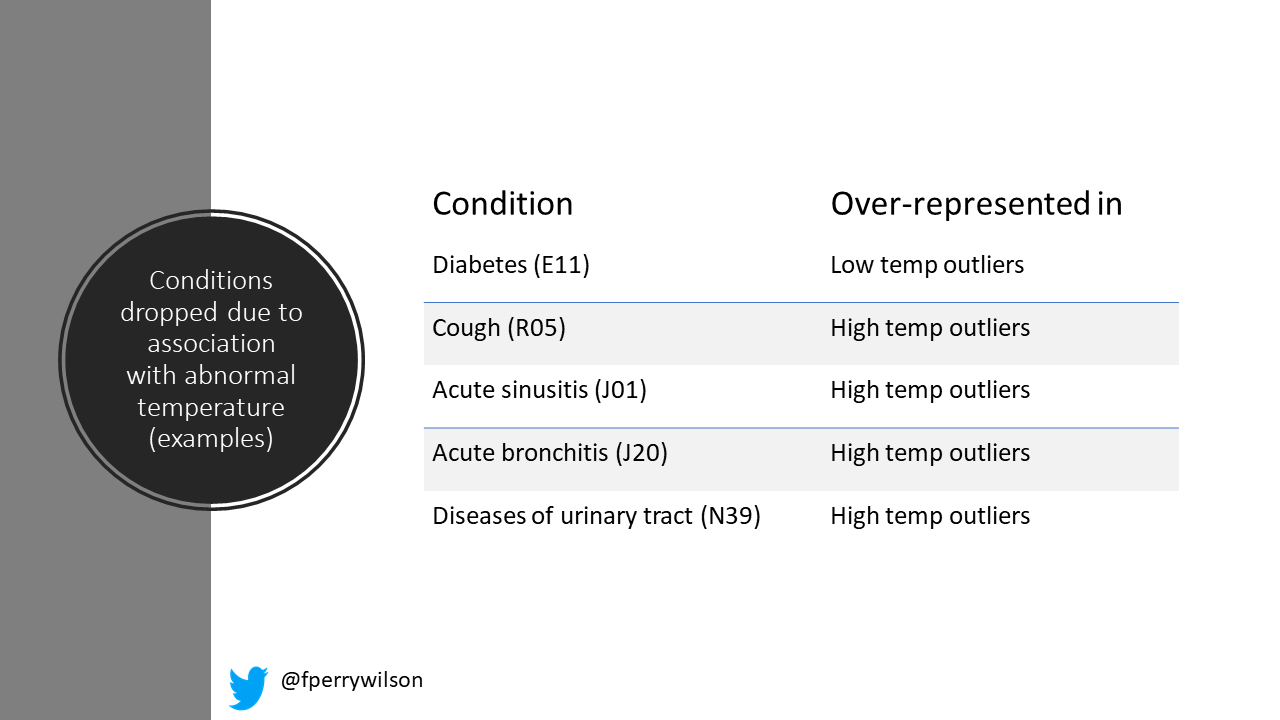
Look at all the diagnosis codes in those distributions. Determine which diagnosis codes are overrepresented in those distributions. Now you have a data-driven way to say – yes these diagnoses are associated with weird temperatures. Next, drop ANYONE from the dataset who has that diagnosis. What you are left with is a normal population, at least a population of people who don’t have a condition that seems to meaningfully affect temperature.
So who got dropped? Well – a lot of people actually. It turned out that diabetes was way over-represented in the outlier group. Although 9.2% of the population had diabetes, 26% of people with very low temperatures did – so everyone with diabetes is removed from the dataset. While 5% of the population had a cough at their encounter, 7% of the people with very high temperature and 7% of the people with very low temperature had a cough – so everyone with cough gets thrown out.
The algorithm excluded people on antibiotics, with sinusitis, urinary tract infections, pneumonia, and, yes a diagnosis of “fever”. The list makes sense, which is always nice when you have a purely algorithmic classification system.
Ok what do we have left? What is the real normal temperature?
Ready?
36.64 degrees Celsius. Or about 98.0 degrees Fahrenheit.
Of course, normal temperature varied depending on the time of day it was measured – higher in the afternoon.

The normal temperature in women tended to be higher than men. The normal temperature declined with age as well.

In fact, the researchers built a nice online calculator where you can put in your own, or your patient’s parameters and calculate normal for them. Here’s mine. My normal temperature, at around 2pm should be 36.7 degrees.
So we’re all more cold-blooded than we thought. Is this just better methods? Maybe. But studies have actually shown that body temperature may be decreasing over time in humans – possibly due to the lower levels of inflammation we face in modern life (thanks to improvements in hygiene and antibiotics).
Of course, I’m sure some of you are asking yourselves if any of this really matters. Is 37 degrees close enough?
Sure – this may be sort of puttering around the edges of physical diagnosis. But I think the methodology is really interesting and can obviously be applied to other broadly collected data points in a similar way. There may also be some medical applications. Most doctors know this instinctively, but this data shows us that thin, older individuals really do run cooler – and we may need to pay more attention to a low-grade fever in that population than we otherwise would.
In any case, it’s time for a little reeducation. If someone asks you what normal body temperature is, just say 36.6 Celsius, 98.0 Fahrenheit. For his work in this area, I suggest we call it Wunderlich’s constant.
A version of this commentary first appeared on Medscape.com.