
What Percent of Medical Studies Are Wrong?
/For the video version, click here.
Some medical studies are wrong. We know this through intuition and experience. But how many? We can tolerate some false-positive studies in the literature – provided the majority of research is still good. Science can correct itself along the way. But what percent of studies that claim a benefit of a drug or intervention are truly true? If you’re an optimist you’ll say somewhere around 95%. And you’re probably way off. To understand why, look no further than the p-value.

R.A. Fisher once said: "Personally, the writer prefers to set a low standard of significance at the 5 percent point… A scientific fact should be regarded as experimentally established only if a properly designed experiment rarely fails to give this level of significance"
The p-value. In the hyper-competitive arena of medical research, it has taken on a level of significance well beyond what was intended by its inventor R. A. Fisher.
And in fact, it may be one of the most misleading statistics in all of medicine.
Let’s start at the beginning. Humans love categories. When we do a study, we want to know if the results are positive or negative. We’re binary creatures with little room for spectrum or subtlety.
Out of the desire to categorize research, the conventional p-value threshold of 0.05 was born. If you perform a statistical test and get a p-value of 0.05, it means that you’d get results as strange as yours, or stranger, 5% of the time, assuming only chance was operating.
Why didn’t I just say “your results have less than a 5% chance of being wrong”? Well, I didn’t say that because it wouldn’t be true. And yet, that’s what people tend to think when they see a low p-value.
To really get some intuition behind this though, you need an example.
Say you and I are walking down the street, and I find a quarter.

All heads and no tails makes Jack a dull boy.
I start flipping it casually, and calling out the results. Heads. Heads. Heads. Heads. At what point do you feel that there is something strange about this quarter? After two heads in a row? After four? After 10? Most people start getting suspicious around 5 heads in a row. I’ll point out that simple probability would suggest this happens a little more than 3% of the time. That “itch” that something isn’t right, something isn’t happening as it should under a benevolent creator who only makes quarters with a head and a tail, gives us our p-value threshold.
Now imagine that it wasn’t me, your friend, picking up a quarter on the side of the street.
It was this guy:

"Just let me flip this coin...waugh."
A street magician. And what’s more, he offers you $2 for every time the quarter comes up tails, but you have to pay him $1 every time the quarter comes up heads. Would you be suspicious? How many heads in a row before you walk away from that bet?
What you’re doing here is using something called “prior probability”. When I just found the quarter on the street, your prior probability that it was a normal, two-sided quarter was very high. You’d expect 50% heads. So it takes me getting a LOT of heads in a row before you’re willing to question your assumption. When the street magician is flipping his quarter, your prior probability of a fair quarter is much lower. It takes less flips to make you think something strange is going on.
But the p-value doesn’t take into account prior probability. It’s a measure of how weird your data is assuming that nothing strange is going on.
This interaction between prior probability and the observed data is quantified in something called Bayes theorem.

Beware, clicking this picture will drive you deep down a Wikipedia rabbit hole.
And it’s key to understanding why the rate of wrong medical research may be very much higher than you would expect.
Let’s imagine we have 100,000 hypotheses to test. 100,000 clinical trials to perform. (In this scenario I have unlimited funding which is very nice).

100,000 total trials. It's like I'm the NIH.
Now, some of these hypotheses are wrong. We hypothesize that drug A will help condition X, but it might not. We have to test it.
Let’s start by assuming that 50% of the hypotheses are wrong, and see how our trials go.
Well, of the 100,000 drugs, 50,000 shouldn’t work. But because of that p-value threshold of 5%, I’ll misclassify 2500 of those as being successful.

50% True hypothesis rate. Is that optimisim or what?
Of the 50,000 drugs that really do work, I’ll capture around 40,000 and miss 10,000 (this assumes a relatively standard 80% “power” to detect an effect where one really exists).

Even assuming much higher power levels doesn't change this much.
So we’ve done our trials and what do we see? Well, 2500 of the 42,500 “positive” trials are false-positives, for a rate of about 6%. Not too shabby.
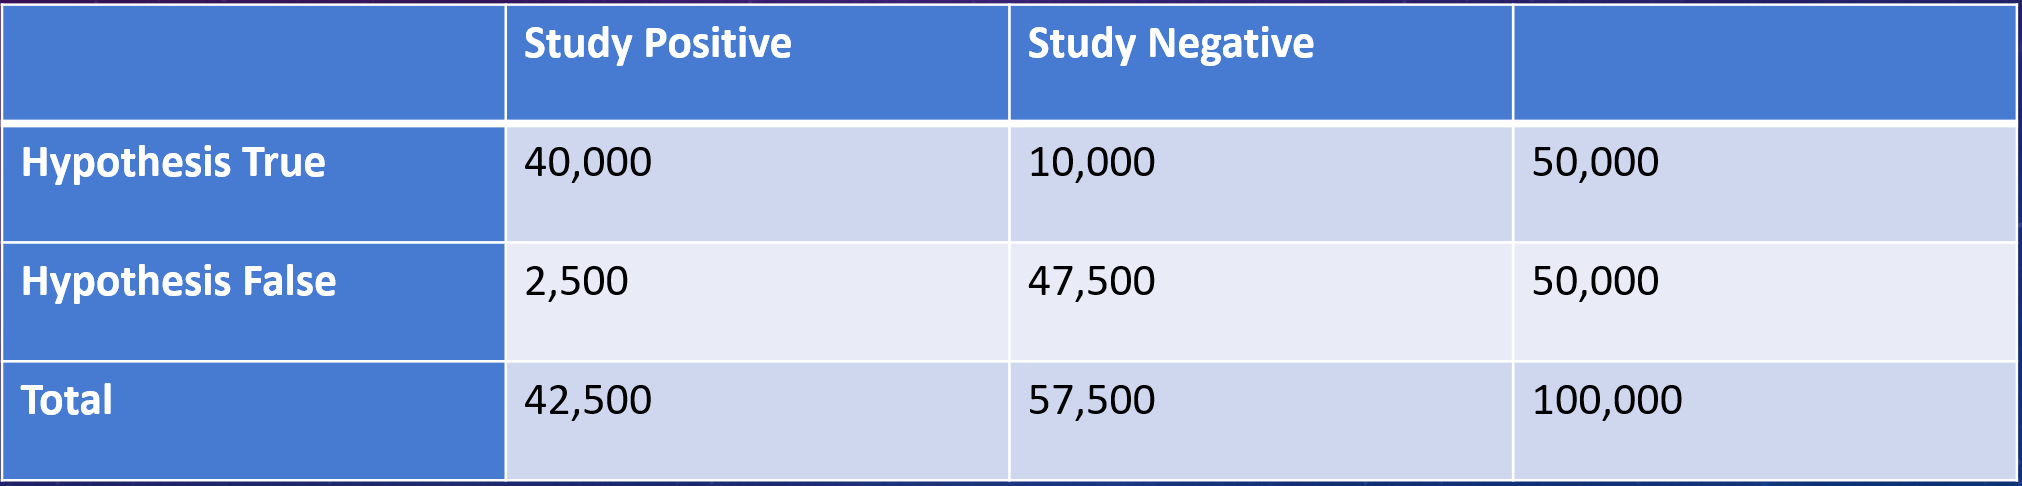
2500/42,500 = 6% or so.
But remember I had assumed that 50% of my hypotheses would work. What if that number is lower? What if it’s more like, say, 10%?
Now we have 90,000 drugs that don’t work and 10,000 that do. Because of that 5% p-value threshold, I’ll falsely think 4500 of the 90,000 inert drugs work for the disease.

Uh-oh. I see where this is going.
Because of 80% power to detect an effect where one really exists, I’ll catch 8000 of the 10,000 drugs that really do work.

Um... Should we notify the press?
Now what are the results of my trials?
Well, 4500 of the 12,500 positive trials are false positives, for a rate of 36%. Now we need to start worrying.

4,500 / 12,500 is around 36%. That is not acceptable.
What I’ve shown you briefly here is that the key to interpreting any “positive” study lies in an assessment of how likely you thought the hypothesis was to be true in the first place. Just because the p-value is 0.04 does NOT mean that the study only has a 4% chance of being false. It can be WAY higher than that – it simply depends how unlikely the hypothesis was to start with.
Here's a handy table to make it clearer:

It's the low-probability hypotheses you really need to worry about.
Despite all the studies in this table being “statistically significant” with a p-value of 0.05, you can see that the probability of a true finding changes dramatically based on how likely you think the result was before the study began.
So how many studies in the medical literature are false positives? It depends very much on the proportion of true hypotheses. If you think that proportion might be is as low as 10% - you’re looking at a 35% false-positive rate in the literature.
And, by the way, this analysis assumes all these studies are done perfectly. No confounding, no publication bias, no inappropriate methods, no fraud. The situation in the medical literature is probably worse than what I’m reporting here.
But on an optimistic note – the process of science saves us from this rabbit hole. Replication of studies marches us up the prior probability ladder giving us more and more confidence if the results are consistent. We should embrace these studies. We should publish them in high profile journals. We should encourage the NIH and other agencies to fund them. Because in the end, the study stands not only on the strength of the data, but on the strength of the hypothesis.